Overview
This section provides actionable insights into customer requests, highlighting trends, response efficiencies, and areas for operational improvement.
Note: Analytics do not cover tickets created directly in Thena.
This feature is gated. If Tag Performance Analytics is not visible under Analytics -> Request Overview in your dashboard, please contact our support team for access.
Features
Filters
- Requests Created On: Select the desired time interval, from Daily to Monthly, with data available for up to a year.
- Standard Filters: Further narrow down by Account Owner, Assignees, Customers, etc.
- CRM Filters: Use these for deeper insights, particularly useful when analyzing trends between Customers and Prospects.
Important: Dashboard data relies on 'Request Created On'. Requests outside this period are excluded.
Summary Cards
Each metric on the summary cards compares the current value against the value from the previous interval, offering a clear view of trends over time. Metrics at a glance (excluding ticket conversions):
- Requests Detected: Total requests within the selected period.
- Unresolved Requests: Requests not resolved by the end of the period.
- Closed Requests: Requests successfully closed within the timeframe.
- Escalated Requests: Count of requests escalated during the selected period.
- One Touch Resolution: Requests resolved with a single vendor response.
- Median First Response Time: Median time to first response, in Working Hours and 24*7.
- Median Time to Resolution: Median resolution time, in Working Hours and 24*7.
Usage: Pay special attention to changes in "One Touch Resolution" and "Median Time to Resolution" metrics. A significant shift in these numbers can indicate a change in request complexity or effectiveness of your response strategies. Use these insights to refine training programs or adjust resource allocation.
Dashboard Cards
Options for data interaction:
- Click to view requests
- View in Full Screen
- Print Chart
- Download options (PNG, JPEG, PDF, SVG, CSV, XLS)
- View Data Table
Visualizations
Interactive elements across all visualizations enhance the analysis:
- Drill-Down: Click on any section to explore associated requests in detail.
- Options Menu: Use the three horizontal bars to access Full Screen view, Print, Download, and Data Table features.
Detailed Visualizations
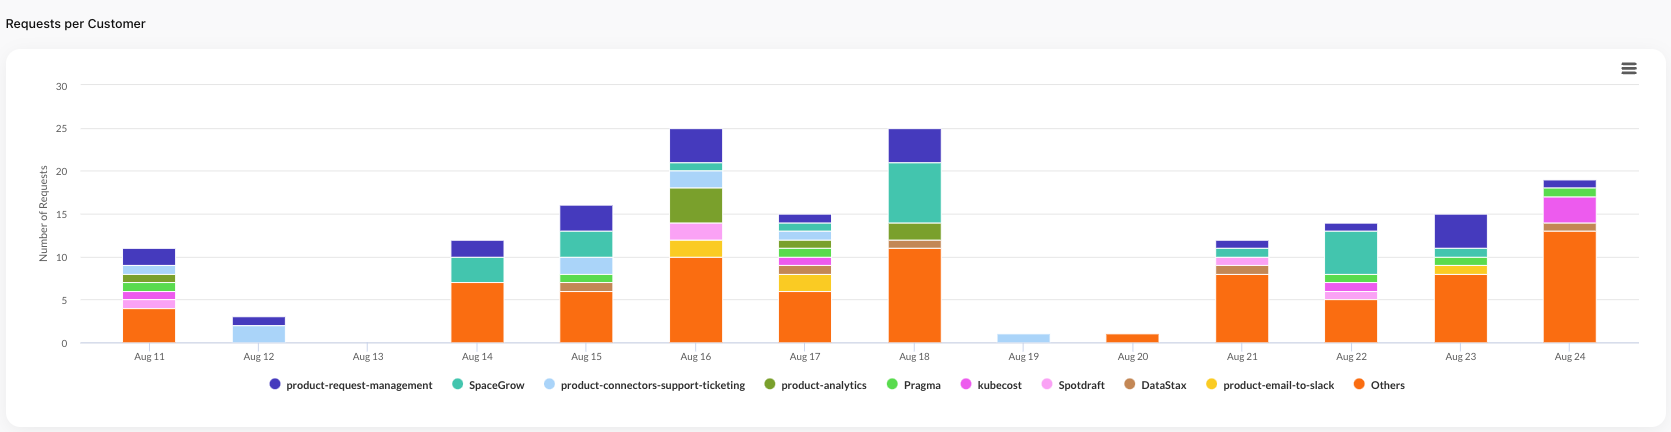
Requests by Customer
- Type: Stacked Bar Chart
- Purpose: Displays the distribution of requests among the top 9 customers, highlighting the most active customers in terms of request volume and grouping the rest into an 'Others' category for comprehensive insights.
- Usage: Identify high-volume customers and consider personalized engagement strategies to address their unique needs or concerns, potentially enhancing customer satisfaction and loyalty.
Request Statuses
Usage: Use the "Open v/s Closed" and "Open Statuses" visualizations to assess the efficiency of your request handling processes. High volumes of open or unresolved requests might indicate the need for process optimization or additional training.
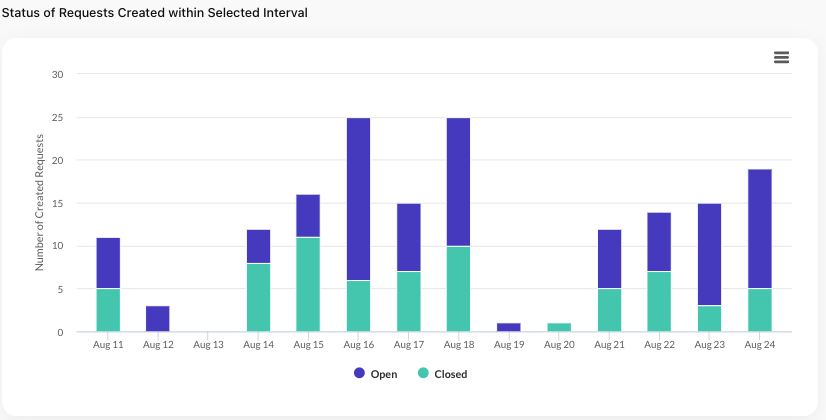
Open v/s Closed
- Type: Stacked Bar Chart
- Purpose: Compares the volume of open requests to closed ones over time, helping to assess the overall efficiency and effectiveness of request resolution processes.
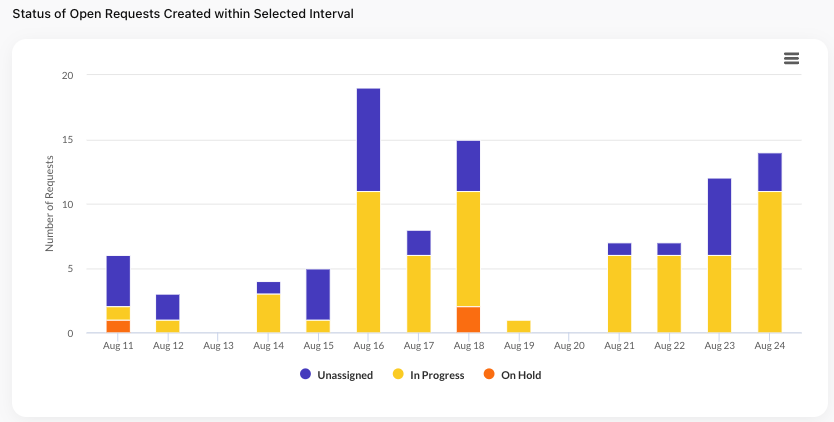
Open Statuses
- Type: Stacked Bar Chart
- Purpose: Provides a detailed view of open requests by status (Unassigned, In Progress, On Hold), aiding in identifying bottlenecks and areas requiring attention or resource allocation.
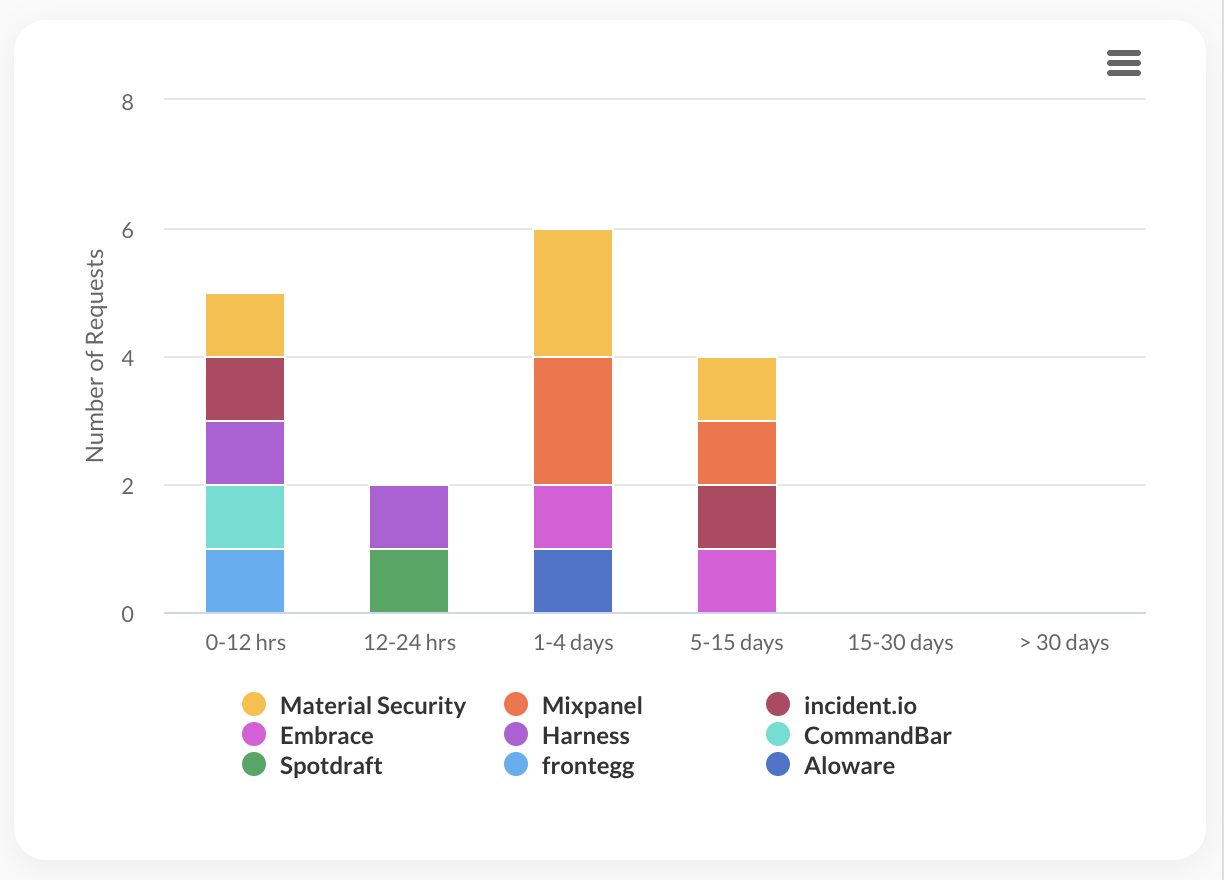
Open Request Age by Customer
- Type: Bar Chart
- Purpose: Identifies customers with the oldest open requests, either in business hours or actual time, which can indicate areas where customer satisfaction could be at risk.
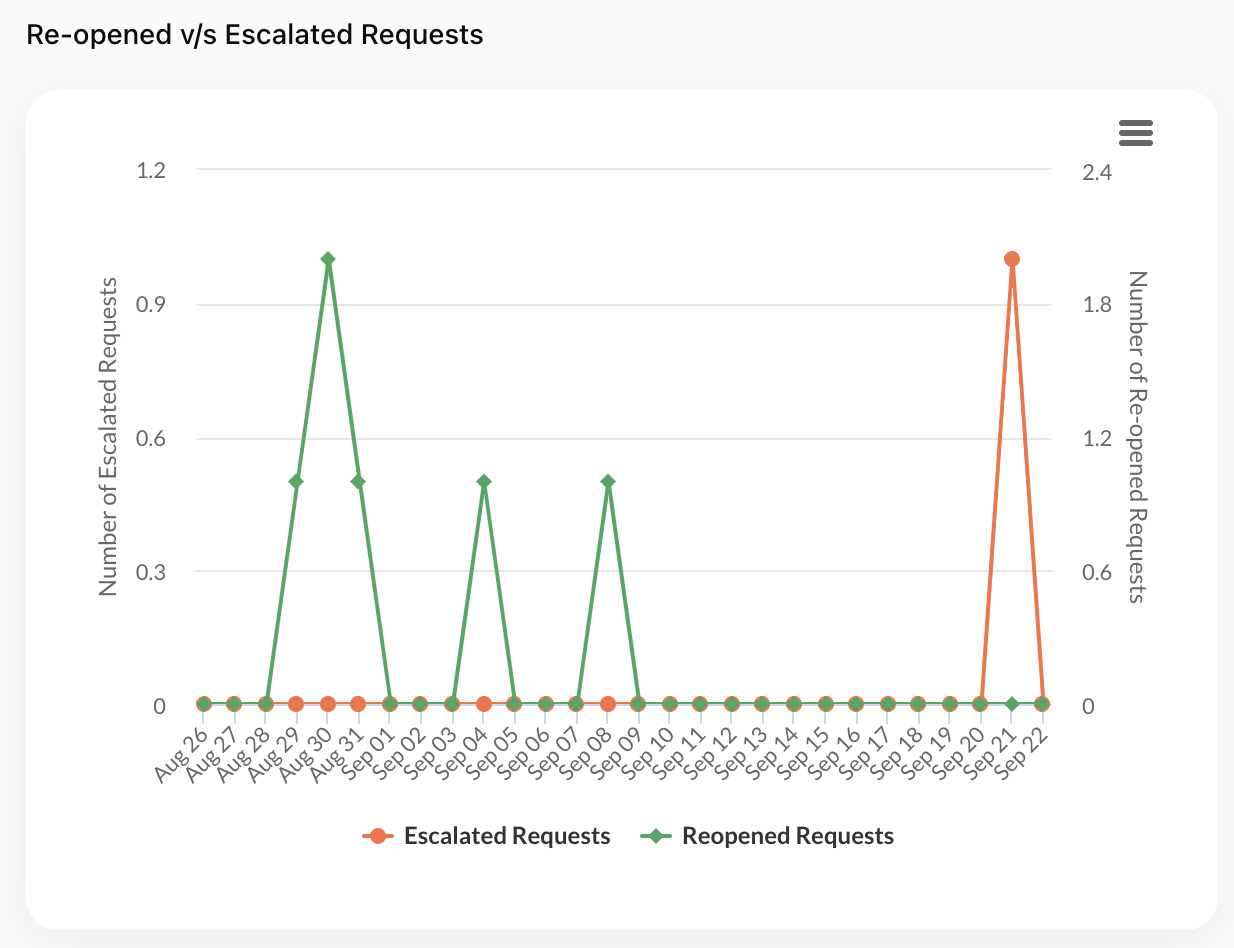
Reopened vs. Escalated Requests
- Type: Dual Axis Line Chart
- Purpose: Tracks and compares the trends of reopened and escalated requests, providing an indication of the quality and durability of resolutions and the escalation management effectiveness.
Note that for both Re-opened and Escalated Requests, we show the date of request escalation/re-open, and not the date of request creation.
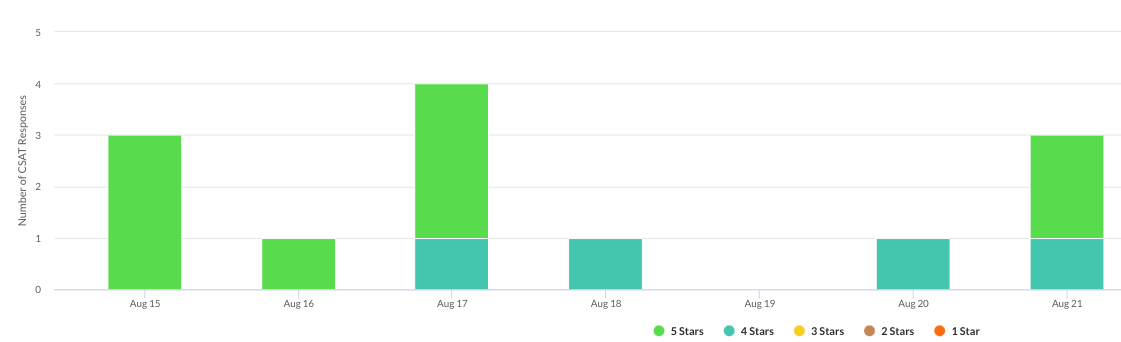
CSAT Responses over Time
- Type: Stacked Bar Chart
- Purpose: Shows the distribution of CSAT scores over time, enabling a clear understanding of customer satisfaction trends and potential areas for service improvement.
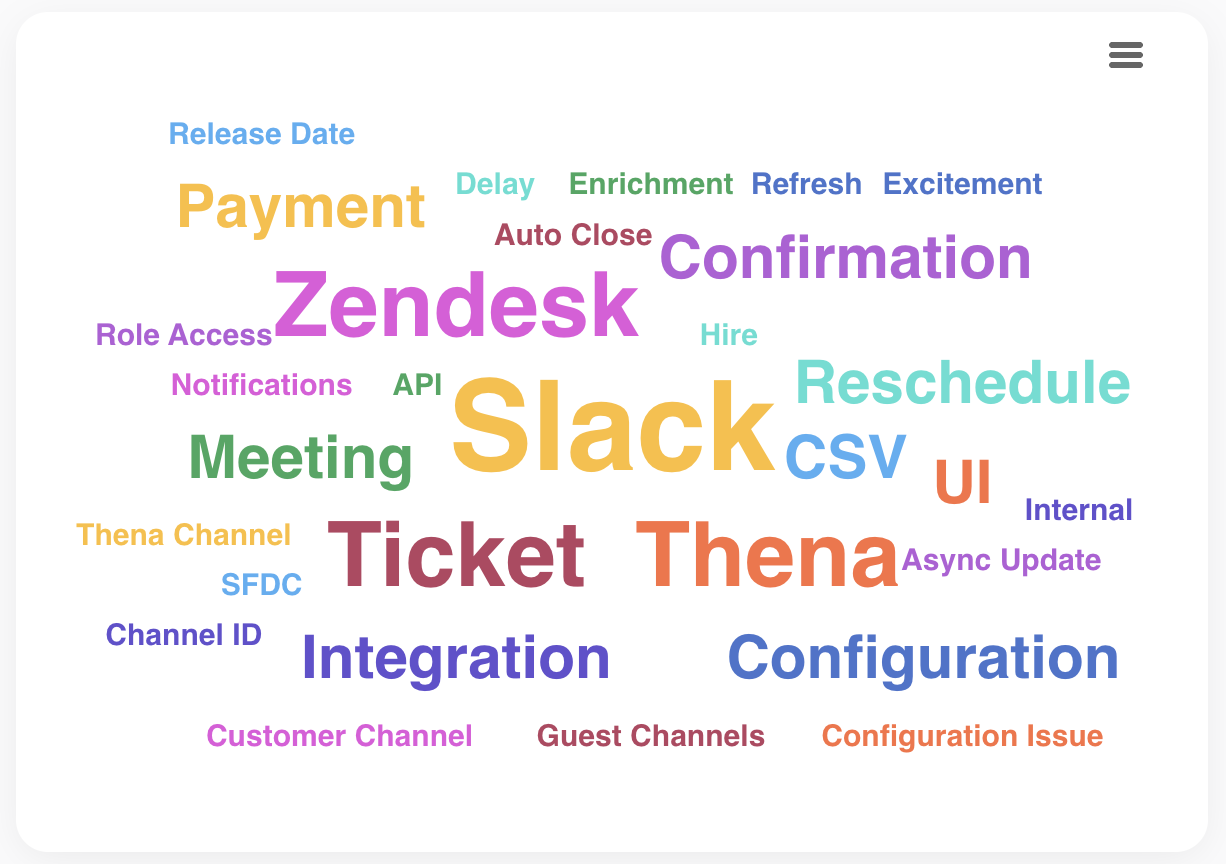
Top AI Tags
- Type: Word Cloud / Tag Cloud
- Purpose: Visualizes the most common themes and topics identified by AI across customer requests, helping to pinpoint prevalent issues or areas of interest.
- Usage: The "Top AI Tags" visualization offers a window into recurring themes and issues across customer requests. Use these insights to guide knowledge base improvements, training focus areas, and product enhancements.
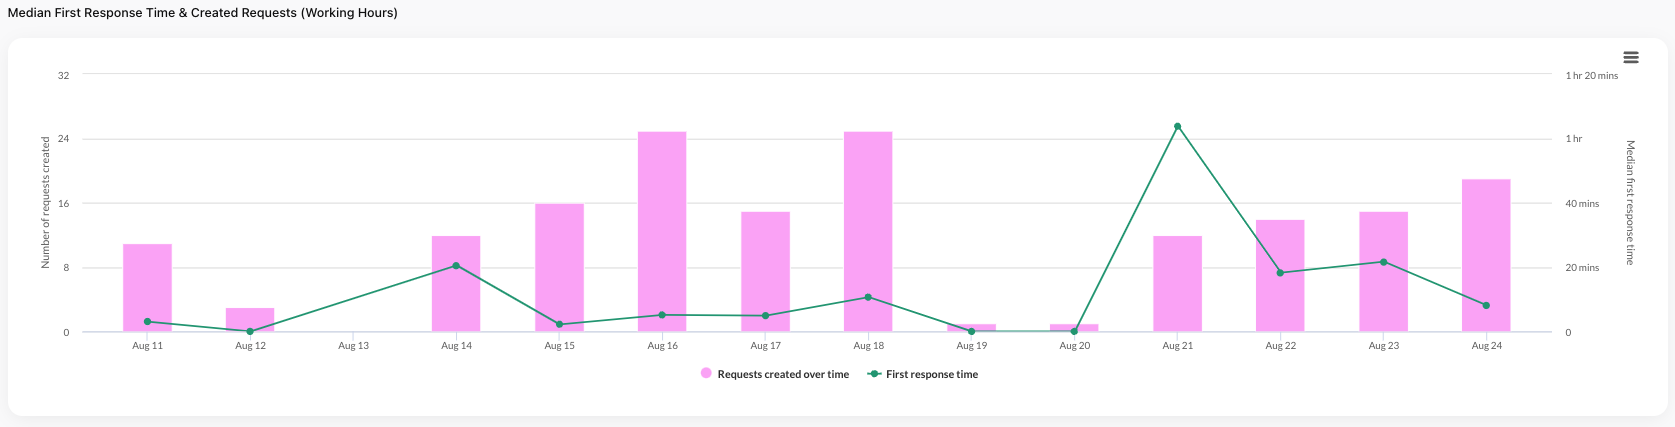
Response & Resolution Times
Median First Response Time & Created Requests
- Type: Line Chart
- Purpose: Correlates the median first response time with the volume of requests created, illustrating how response efficiency may vary with workload.
- Usage: The "Median First Response Time & Created Requests" visualization can be instrumental in managing team workload and setting realistic response time goals. Analyze how response times fluctuate with request volumes to identify optimal staffing levels or peak periods requiring additional attention.
First response time will be 0 for any requests that were raised and answered outside of working hours.
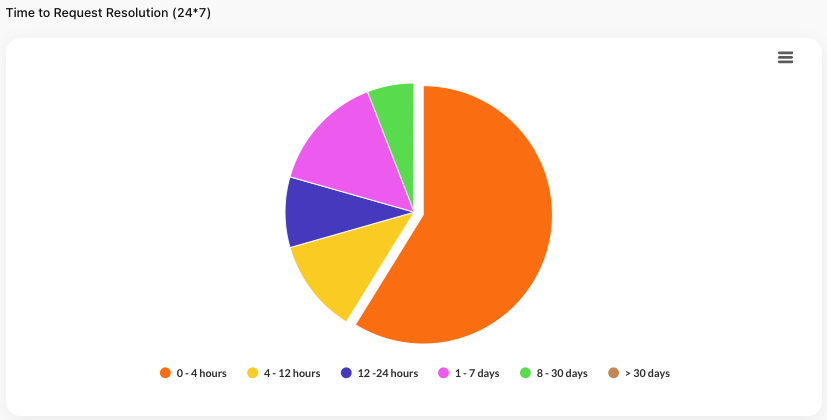
Time to Request Resolution (Actual Time)
- Type: Pie Chart
- Purpose: Breaks down the resolution times of closed requests into distinct intervals, providing a snapshot of resolution efficiency and highlighting areas for potential process acceleration.
Re-opened requests are not considered in Time to Request Resolution.
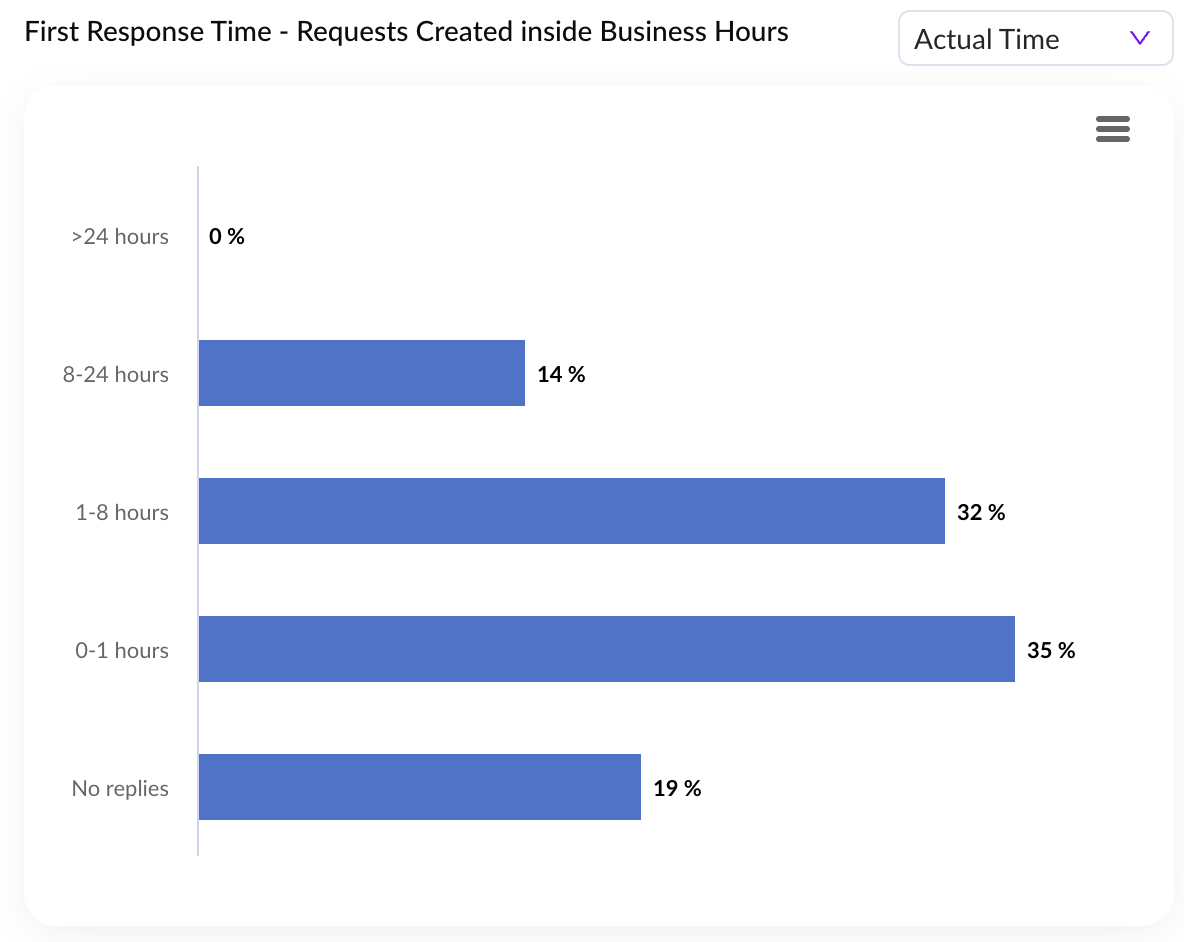
First Response Time - Requests Created Inside Working Hours
- Type: Histogram
- Purpose: Focuses on the first response times for requests initiated within working hours, shedding light on the team's responsiveness during official business hours.
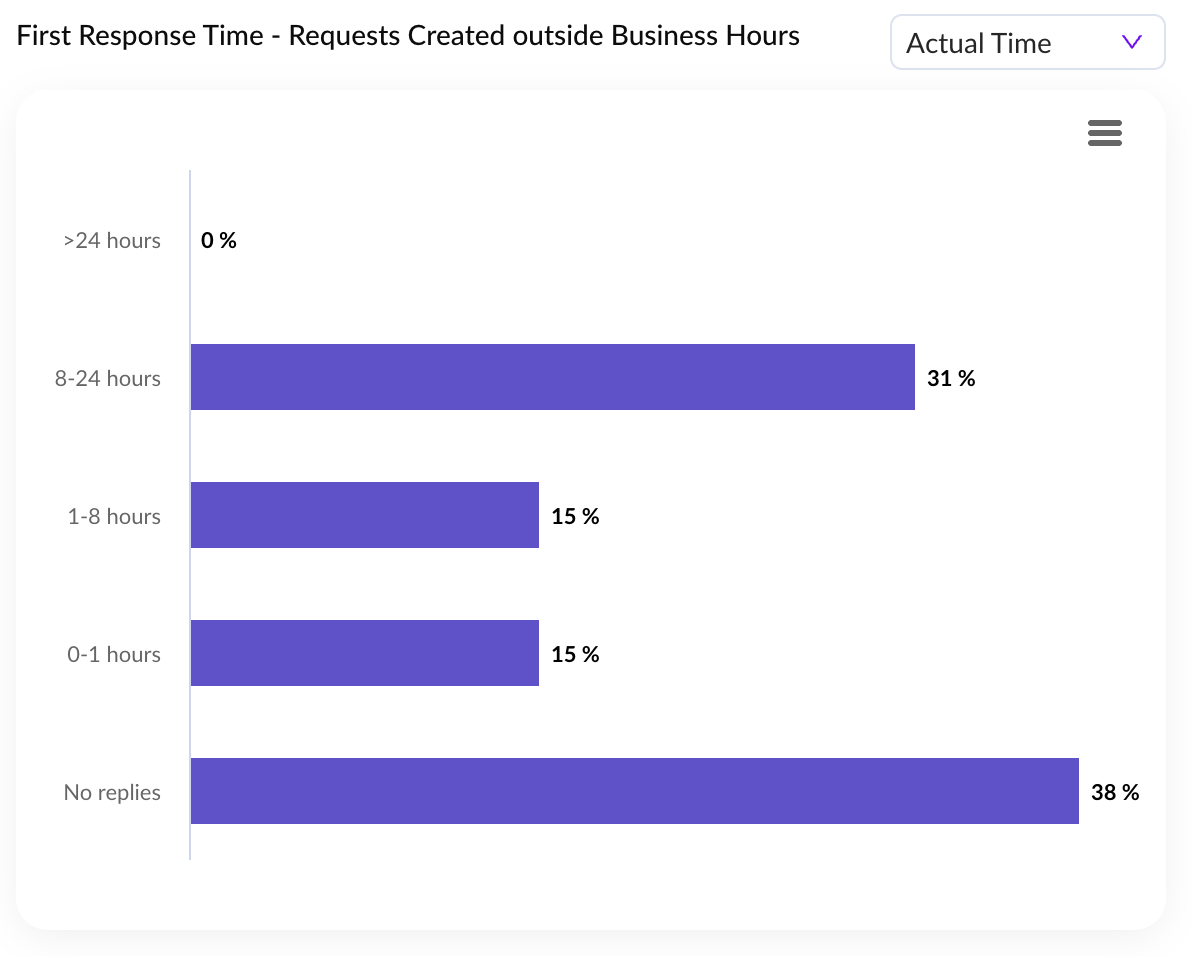
First Response Time - Requests Created Outside Working Hours
- Type: Histogram
- Purpose: Analyzes first response times for requests that originated outside of standard business hours, offering insights into after-hours support performance.
Pro Tips
- Strategic Analysis: Combine CRM filters with Tag Performance Analytics to gain strategic insights into different customer segments and their support needs. Regular review sessions to discuss these insights can lead to actionable strategies that improve customer satisfaction.
- Efficiency Optimization: Use the detailed analytics to identify areas for process improvement, driving efficiency and enhancing customer satisfaction. Look for patterns in the data that suggest operational bottlenecks or opportunities for streamlining processes.
FAQs
Q: Are re-opened requests through Kanban included in 'Reopened' metrics?
A: Requests reopened through the Kanban board are currently not included due to our tracking methodology. We're exploring updates to incorporate these actions.
Q: Why are there no escalation counts before Sept 20?
A: Escalation data is available from September 20th onwards due to a workflow update. Prior escalations aren't reflected in the dashboard.
Q: How can I view specific requests in a visualization?
A: A hover feature is in development to allow viewing specific requests contributing to a visualization, enhancing interactivity and detail.
Q: When will custom views be supported?
A: Custom views based on specific filters are planned. We're seeking design partners for collaboration. Interested users are encouraged to contact us.
Q: How can I differentiate analytics by request source?
A: The Request Source feature distinguishes requests from Email, Slack, Web, and Teams, offering insights into communication preferences.
Q: Can I select specific dates in Request Overview?
A: Currently, Request Overview shows fixed intervals. For specific dates, the Custom Analytics view is recommended for its flexibility.
Updated 4 months ago